We’re done waiting ! After years of non-progress Google officially announced yesterday their massive step towards unification of data coming from applications and web platforms in GA : Web + App Properties.
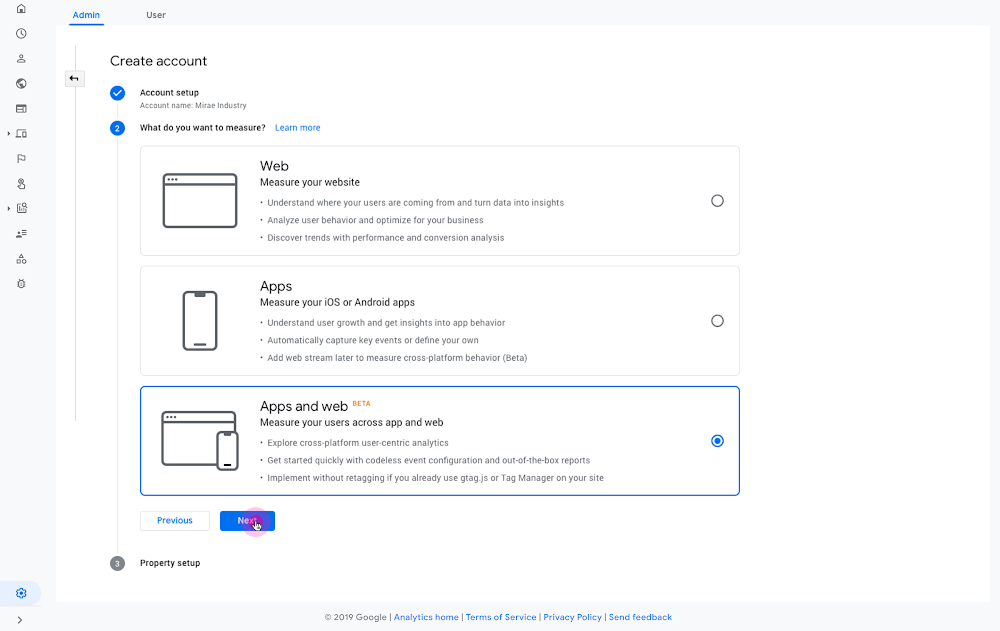
Image Source : Google Blog
In a context where people are interacting when and how they like with a brand, being able to get insights from their cross-platform journeys has become critical for businesses to understand customer needs, and provide better experiences.
The new feature Google released is definitely a step in that direction.
Web + App Properties - What does it mean?
Basically, you’ll now have the opportunity to create a new property type in Google Analytics, which allows you to combine both App and Web data in one single unified property.
This means access to reports that use one single dataset of consistent metrics and dimensions for all your platforms, making it possible for you to see fully integrated reporting across Apps and Web.
Wonder which marketing channel is driving most users to your business, whatever it is on your website or your app? How many unique users you have? How many conversions happened on your website and your App? Well, you can now have all these answers in one single place.
Why should you care?
Today, if you have both an App and Website, you’re collecting and analysing your data in separate environments : Google Analytics for Firebase (GA4F) for your App, and Google Analytics for the Web.
Does it make sense for your business to keep looking at this appart while most KPI and needs are the same ? Very unlikely.
Web + App properties is a simple way to cover this, and it’s only the beginning.
Let’s introduce... Enhanced Measurement !
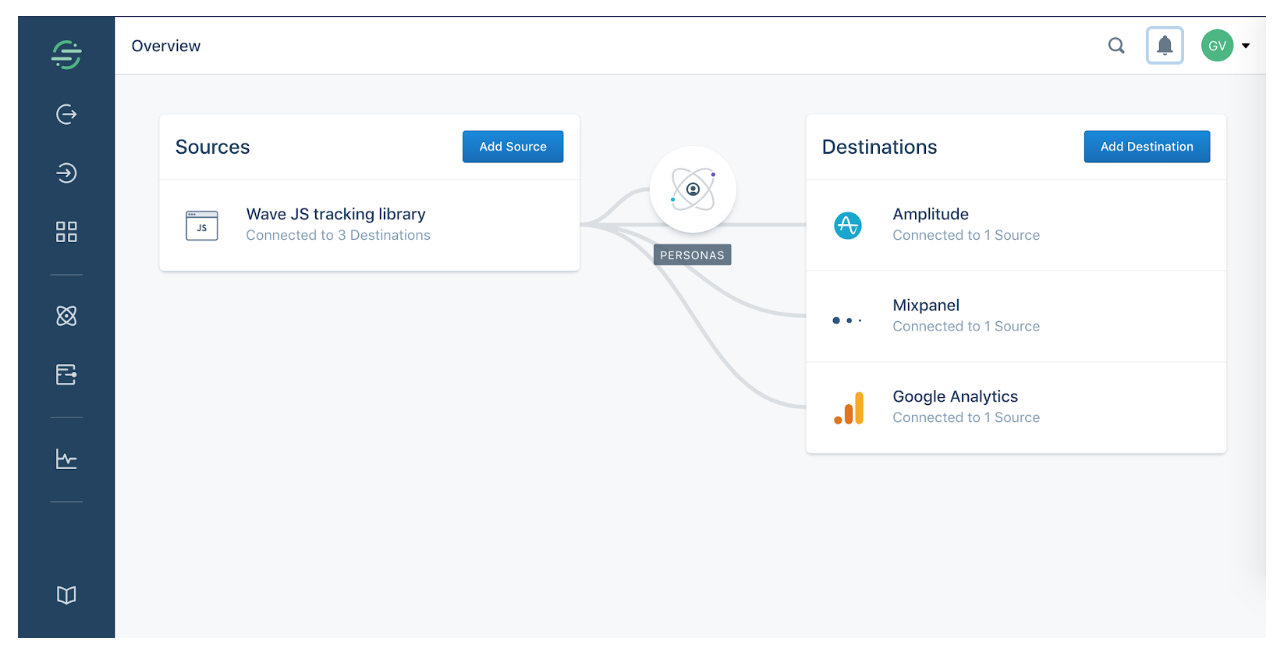
The crucial element that enables all of this is a new data model. Google will be moving away from its traditional Session measurement that Google Analytics has been using over the last decade. Instead of that, they are moving towards an Event model, quite similar to the one that is used already within Google Analytics for Firebase (App Tracking) or some other technologies such as Mixpanel, Amplitude & Segment. Basically : a whole different data-scheme.. Exciting !
It’s quite a big shift, and it seems that GA teams understood that it might be a heavy move for business to re-implement, so they’re trying to make the transition smoother with a new amazing feature : Enhanced Measurement.
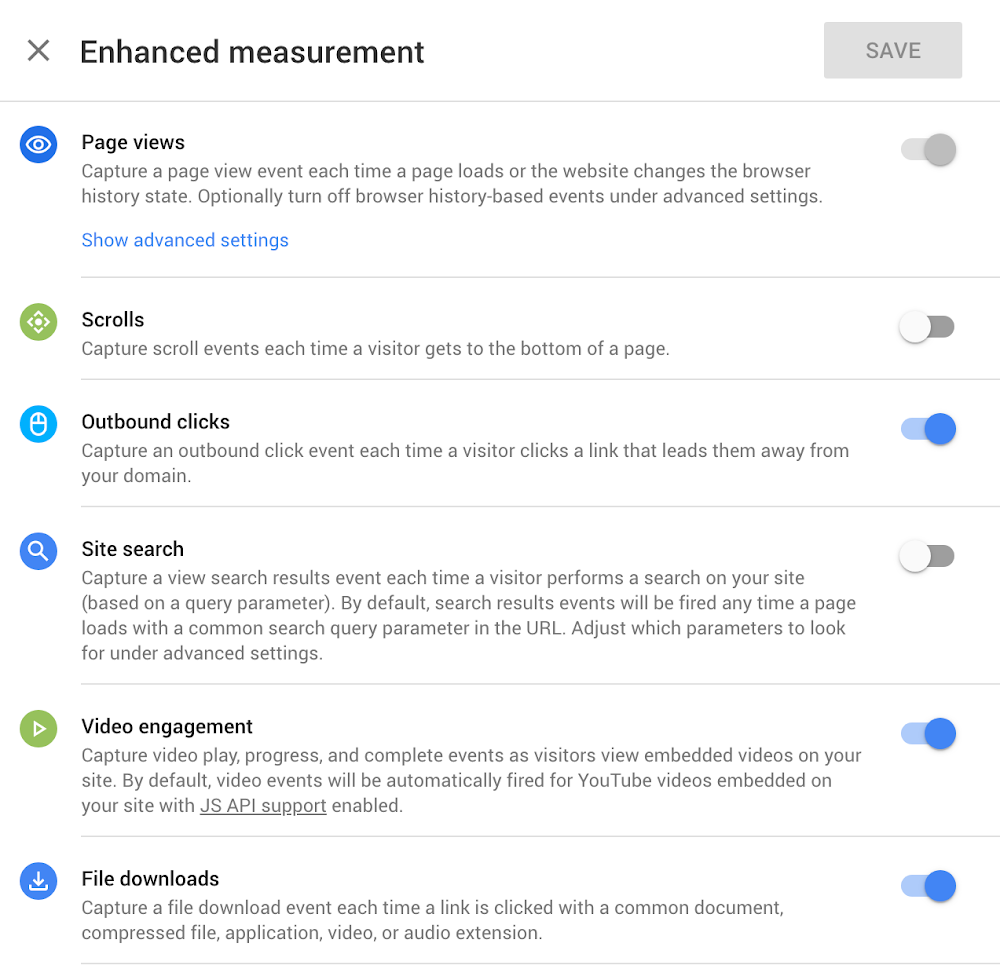
Image Source : Google Blog
Simply said, this feature aims to detect some of the most common events that you may want to track, and give you the opportunity to automatically track those things, such as Page Views or Scrolls on pages - all this directly from the Admin panel. Say bye to the manual work of tagging some events on your side with extra code !
Note that for now, only a limited list of events are added, but we can expect that Google Analytics team might keep building this out to a much more extensive and easy-to-use tracking system.
Good news never comes alone : New Reports for Cross-platform Analysis !
Together with this, Google also offers more flexible tools to help you make sense of your data, and gather insights out of it : the new Analysis Module.
This module enables you to look into your data the way you want, without the limitations of pre-defined reports. Here is a non-exhaustive list of techniques you’ll be able to use :
- Exploration : Visualize your data easily through a drag & drop interface allowing combination of multiple elements (dimensions, metrics, ...)
Image Source : Google Blog
- Path Analysis : help you visualizing actions taken on the user’s Path.
Image Source : Google Blog
- Funnels : Understand & discover sequences of events your users are undertaking on your website and app.
Image Source : Google Blog
That’s only a preview of the many new reporting features that come with this update. More details about this in a next article.
Practical information
You might wonder how and when you’ll be able to try this out ?
Good news - the feature is currently being rolled out publicly (Open Beta) and should be accessible for most business that are eligible ( = that use GA for Firebase already) in the coming weeks.
All you have to do once you’re whitelisted is to activate the feature. For that, two options :
- Create a new App + Web Property in GA
- Upgrade an existing Firebase Project.
All you have to do now is trying this out, and enjoy !
No doubts that after reading all this, you’ll be as excited as we are about what’s next here. We’re currently deep-testing the feature, so stay tuned - more articles to come on this topic.
{snippet cedriclequenne-en}