1960 to 2054 - A century of evolution for the advertising industry
Feature films and TV series often try to project the viewer into the future (what could it look like), often high on action and adrenaline. These can also be storifications of the past (what was it like), often with an extra dose of drama. Such fiction often challenge the viewer's routine.
AMC’s TV series “Mad Men”, which covers Madison Avenue’s Ad Men from 1960 until 1970, is often used to illustrate the past of advertising and account management. Set in the post-war decades, Mad Men illustrates the rise of consumerism, the arrival of television and, naturally, the advertising boom. On the other end of the timeline, the movie Minority Report (released in 2002) did a great job predicting elements of the current century, advertising included. Taking place in 2054, the movie presents a strangely accurate future world where advanced Artificial Intelligence (AI) can predict crime and where self driving cars reign supreme. It envisioned augmented reality (AR) and widespread touch and motion controlled screens and interfaces (the Wii, mass market touch screens, Microsoft Kinect all came out years after the movie) voice controlled homes (think of Alexa, Google Home and the hundreds of voice enabled home applications), and last but not least: ultra personalised advertising.
Are we there yet? In a sense, yes. But much remains to be done for a seamless integration of technologies, and user (customer) experience. A paradigm shift will also have to occur between ‘how we used to do things’ and ‘how we should do things’. Ad men still remain crucial elements of the equation, but gut feelings and simplistic correlations will have to be set aside.
Did you say Digital Advertising?
Digital advertising is not an entirely new discipline that emerged out of the blue. It is simply the evolution of traditional marketing practices alongside an evolving society and new technological capabilities. Digital advertising is a subset of marketing. Today’s basics are the same as before:
Addressing the right message to the right person at the right time
Mass media campaigns for brand awareness
Targeted campaigns and actions to stimulate a purchase
But then what has changed?
Modern technology has created entirely new media channels. Ad campaigns still run on TV, in newspapers, at the movies and on street billboards, but billions of ad impressions are now taking place online, on websites, in our emails, in our online videos, on social media.
Technology is also impacting the traditional media. Our newspapers are becoming online news sites and social media posts, our street billboards are becoming digital and interactive. TV content is consumed over the top, and ads are served based on your device type, location and socio demographic persona.
The result of the encounter of the world of advertising and modern technology has one major consequence: infinite fragmentation.
The infinite fragmentation
Throughout history, technology (think about the invention of print) has had an impact on the way that we communicate and do commerce. In the last decade technology has created infinite marketing fragmentation. To pretend to be efficient, advertisers now have to handle as many messages and touchpoints as there are individuals in their target audience.
At the beginning it was easy. Media became digital, so media buying digitised as well. Media planners would buy an ad campaign in the offline press, on TV and on the radio, and digital inventory would be added to the mix. Soon enough, media owners started segmenting their inventory in order to offer advertisers with more qualitative access to their audience. Advertisers could then buy ad space that was ‘most likely’ to be read by parents, business affictionatos, car lovers, etc.
Digital media buying has since then become programmatic. This means that advertisers no longer negotiate the price for specific inventory for a specific duration. Nowadays, most media impressions are bought programmatically, as a real time auction, within open or tailored inventory.
Since then, technology has added the capacity to identify individuals within the mass. This is done with first and/or third party data. Advertiser’s business and website data can be layered on top of each of those real time auctions, allowing for a different message or different auction based on the targeted individual’s history and business potential. One of the market’s most advanced project (as of Q4 2019) reflecting this complexity is the recent collaboration between AdSomeNoise, Semetis and technology & media partners to launch a Video Dynamic Creative Optimisation campaign.
As pointed out above, technology is not only creating new online media avenues. Traditional media is being transformed. Radio and television are becoming digital, so are the street billboards. This new form factor alone is revolutionary. Street billboards can be updated with the new ad from a distance, and customised based on who’s walking by. Radio ads can be bought programmatically. This is a paradigm change from the old ways of buying media, from “one campaign fits all” to “my message can adapt automatically and can touch anyone, anywhere, anytime”. As offline media can become digital, ‘online’ no longer means digital, and the lines between those concepts are blurring.
All of those elements are creating today’s infinite fragmentation, the biggest challenge in marketing today:
Immeasurable touch points per customer, available programmatically or not.
A prodigious variety within the digital spectrum (online content, apps, social networks, open inventory, tailored inventory, …).
Vast targeting possibilities (socio-demographic, geographic, behavior, device, time, weather, …).
Multiple marketing objectives (awareness, consideration, action, retention, buzz, word of mouth, …).
A huge Data management challenge.
How can brands and agencies make sense of this ultra-segmentation? Data.
One of the biggest opportunities in marketing today is automation. The biggest challenge is the attribution of your business results to your initiatives and investments.
Both begin with measuring the right things, and both require a change in mindset. Automation does not mean working less and replacing your specialists with machines. Automation is leveraging technology to work at scale. On the other hand, attribution is not a magical one-push button, it’s a data-driven business mindset around your marketing initiatives.
Data as a means to consolidation ?
Big Data, Small Data, Smart Data, Personal Data, Open Data, we have heard every variation of it in the last decade. The good news is that most organisations are currently sitting on tons of collected data. The bad news is that such collection has not always been orchestrated with a long term vision, and data as well as measurement evolves continuously. The result? Data silos between departments and business units. The infinite fragmentation is also impacting the way organisations measure, collect and use data.
From a marketing perspective, the trend is to embed data and measurement in every media initiative, starting from digital. Of course we have been measuring our campaigns’ impact for years with polls, sampling, market research and uplift studies. The difference is that the digitisation of the industry allows for the measurement to be built in, and not handled by a third party a posteriori. Some organisations created in the digital age are managing to do this. Older organisations are having a harder time with this change.
By change I am referring to the way that the advertising job has changed over the last 10 years, and that it will keep on changing for the 10 years to come. This means that the job will require new skills. Media is more than ever a means to an end. It cannot be separated from the data and the business. Automation and data driven marketing does not mean that creativity and human interactions are no longer relevant. But gut feeling marketing will evidently come to an end. We need to start training our data scientists to become business minded, and our marketeers to be data minded. This will impact recruitment as well.
In principle, all of this data and intelligence is great news for advertisers and agencies. Budgets are better allocated, waste is limited and consumers are seeing more relevant ads. But there is a major pitfall. Don’t expect 100% data accuracy. Realistic incremental improvements are better that unrealistic ideal case scenarios. We’ve already taken position on this from a web analytics angle several months ago in our article: “My Web Analytics Data is not perfect and I’m OK with it”. Our advice is to start small, incremental and keep things manageable. Measurement is not an end in itself. Data should allow you to make incrementally better decisions for your business.
Final thoughts - Adopt a perennial data mindset
This fast evolving industry is keeping us on our toes, and we are loving it. So many things could be done, we could work indefinitely. We must learn to keep the focus on what matters, anticipate market and technology trends, and accommodate the emergence of new challenges - such as Data Privacy - and other unintended consequences of our industry.
A couple of days ago, you might have seen a new tab in your Google Analytics report: Attribution Beta. This news Beta from Google did not make a lot of noise in the news, but only a couple of weeks after the launch of the “Web + App” properties in Google Analytics, it is another big move from Google.
It has been a while since we were patiently waiting for an improvement on the classic Multi-Channels Funnels reports in Google Analytics. But then, what does the new Beta has to offer?
For those who need a refresher on attribution, I encourage you to go through that introduction to the attribution article. It’s only a 5 minutes read and it will help you get a good understanding of the topic.
For the lazy ones, here is how Google defines Attribution:
Attribution is the act of assigning credit for conversions to different ads, clicks, and factors along a user's path to completing a conversion. An attribution model can be a rule, a set of rules, or a data-driven algorithm that determines how credit for conversions is assigned to touchpoints on conversion paths.
It is the last sentence of this definition that is interesting for us today. Historically, Google and other similar Analytics tools provided marketers with default rule-based models such First & Last Click, Time Decay, Linear or Position Based attribution. All those models were interesting to look at when trying to attribute the real value of any touchpoint other than the Last Click default model.
But the truth is that all those models are wrong and misleading, in their own specific ways.
For the ones lucky enough to run on Google Analytics 360 (paid version), Data-Driven Attribution might not be new to you, but for the others, it is a true game-changer to have access to a free data-driven attribution tool.
Data-Driven Attribution Model
The new feature of the Attribution that gets us all excited is the launch of Data-Driven Attribution inside Google Analytics (finally!). DDA is a machine-learning-based attribution model that evaluates both the conversions and the non-conversions path to better allocate credit to any touchpoint.
As explained by Google: the model incorporates factors such as time from conversion, device type, number of ad interactions, the order of ad exposure, and the type of creative assets. Using a counterfactual approach, the model contrasts what happened with what could have occurred to determine which touchpoints are most likely to drive conversions. The model attributes conversion credit to these touchpoints based on this likelihood.
Here is a visual example of how this model works:
In the example above, Google will compare the path to conversion with the path that did not convert and will, therefore, be able to allocate more credit to the differentiator, in this case, the bannering touchpoint.
Is there any requirement?
Asking the question is already answering it. As the model is data-driven, it needs a minimum volume before you can access your first data-driven models. The minimum requirement is to have at least 600 conversions within the last 30 days. Note that eligibility for data-driven attribution is determined by the data for each conversion type, so you may see a Data-driven model for some of your website and Google Analytics conversions but not for others. Also, what is true to access the DDA model is also true to keep accessing it, so if your conversion volume drops under the minimum requirement, you won’t be able to access your DDA report anymore.
Test, test & test
As the product is still a beta, you can expect some limitations. For example, it is not (yet?) possible to use Custom Channel Groups in the different models. Another limitation is the absence of Google Ads cost data and click data for reporting.
We can expect those features to be incorporated as the product grows.
We, therefore, encourage you to test this new beta and share feedback with the development teams in order to make the product evolve in the way marketers are expecting it to evolve. From our experience, Google engineers take those feedback very seriously and do not hesitate to include those in their product roadmap.
We won’t teach you anything by telling you that videos are, and will keep being a powerful (if not the most powerful) tool in terms of content marketing. Videos are a great means to create strong emotional connections by visually capturing the attention of customers, leading to higher brand engagement and increased leads and sales. According to recent studies (Forbes), by the end of 2019 video will represent 80% of global internet traffic, which is huge.
YouTube is the second most visited site on the web worldwide, right after Google. Despite this, most digital marketers still tend to consider it as another social media site. However, the key of success on YouTube is not about posting content, but optimizing it - exactly like it is for your website.
In order to better understand the value of SEO on YouTube, and let you understand why you should make every effort possible to improve your positioning, here are some figures :
As mentioned, YouTube is the second most used Search Engine
It’s 2 billion active monthly users, 30+ million daily !
More than 60% of YouTube traffic comes from mobile.
YouTube reaches more adults aged 18 to 35 than any of traditional Television channel.
60% of people prefer video platforms to live television.
YouTube was bought in 2006 by Google for $1,65 billion as a way to combine they search and organization competenties with YouTube’s video library.
When it comes to YouTube SEO, most of the optimization process can be encapsulated in a process that you can apply to all your old videos, and then to all video that you’ll publish.
Why is it important to Optimise SEO On YouTube ?
As we already mentioned, Google acquired YouTube in 2006 and seeks to highlight it for maximum profitability. This implies that YouTube videos are shown on Google, and more and more occupy the top positions.
This is a golden opportunity for any brand, but especially incase of a new or poorly optimised website that has little domain authority and thus low confidence from Google. In that case, YouTube allows to take off since the social network has all the necessary authority needed to position yourself in the top search results, and improving your SEO by doing that (it all works together).
As you might imagine, competition is high on the most used video search engine. The good news is that the number of content producers making actual efforts to optimize their videos is still quite low, but increasing everyday.
Another good point, search results page on YouTube shows up to 20 results on the front page, while Google only shows up to 10 - this means more chances for you to position yourself on the first page of results.
All these are good reasons to start optimizing your YouTube SEO as of now.
Where to start with YouTube Search Optimisation ?
As for all search engine optimisation, the very first step before going any further is to know what you have to optimize for. You got the idea, we’ll talk about keywords again !
Looking into the keyword you want, and should try to position yourself is the cornerstone of any good SEO strategy. For that, keyword research needs to be done, as it will help you identify keywords people are looking for, but also how competitive these will be.
Performing a keyword research on YouTube is quite straightforward - just start by typing some keywords related to the topic you want to get visibility on, for example “SEO optimisation” :
YouTube will automatically show you the most searched queries related to your keywords : it’s that easy, you have your list of most qualitative keywords.
Next step is then to see how competitive these keywords are in order to choose your battles. Once again, the process is rather simple : just look at the results shown for the keywords in your list. It used to be very easy as YouTube was showing the number of results - it’s not the case anymore. What you will do instead is to check the first few results that are shown and see if those seem to be optimized based on the best practices we’ll share with you in the next article.
You’re done with your keyword research ! From your list, select a relevant keyword where there seem to be room for you to rank, and move to the next step : optimizing your video content for that query, by focusing on the key success factors.
More about that in the next article : YouTube SEO: Key Success Factors.
Did you know that you could save more than 50% of your time on Facebook Ads Manager? Whether it is for creating new campaigns, using the structure of old campaigns or make adjustments to existing campaigns, you can simply use this powerful feature. Discover what “Bulk Import & Export” can mean for you.
What is “Bulk Import & Export”?
“Bulk Import & Export” is a feature on Facebook that allows you to create/to make changes in bulk to campaigns, ad groups and ads by using an Excel file. This way of working is similar to Google Sheets on Editor / Google Ads and SDF (structured data files) on DV360, as you export, make changes and upload the adapted content back on the platform.
Why is it useful?
“Bulk Import & Export” can help you to:
Quickly create many ad sets or ads. You can create new campaigns, ad sets and ads directly in excel or you can add ads to preexisting ad sets.
Bulk edit across multiple campaigns, ad sets or ads at the same time.
Transfer campaigns from one account to another
Set-up campaigns that are complex, similar to others or done on a regular basis
Quickly export campaigns to check the settings in detail
Especially when you want to create/edit a large number of ads, this feature can be very useful. Before this feature was available through Power Editor, a spin-off of Facebook Ads Manager that was more advanced in terms of choice of placements, objectives, audiences and where it was possible to edit in bulk. As it did not make sense to have two different platforms, the Power Editor was merged into Facebook Ads Manager. This allows a more efficient management of all your campaigns directly in the platform.
Similarly to Google Editor and DV360 when uploading the changes you will see directly in the platform whether the import was successful or not. If there are errors, Facebook will give information about what the issue is and where the error occurred.
How to proceed concretely?
If you want to create a new campaign(s), it is always recommended to start creating your campaign(s) first, then your ad set(s) and finally your ad(s).
The way of working is always the same: you export a selection of campaigns from Facebook Ads Manager, you adapt it based on your needs and you import it back to Facebook Ads Manager.
There are two different ways to create a campaign:
Download an existing campaign with similar strategy and targeting, and adapt it. Delete all the existing IDs so that a new campaign can be created.
Create a new campaign from scratch in Ads Manager, with the right targeting and settings, download it, and add more rows for the different ad sets or ads. For the newly created ad sets and ads do not forget to delete the existing IDs.
It is important to keep in mind that uploading a campaign/ad set/ad without an ID will create a new one, while uploading it with the existing ID will modify the existing campaign/ad set/ad.
Here below are some examples when “Bulk Import & Export” could save you some time:
Create new campaigns - If you have an always-on campaign and there is a new Business Manager. You can transfer the campaign to the new account. In this case you don’t have to start from scratch, you just need to export, delete the existing IDs, optionally change the conversion pixel ID and then import it in the new account.
Edit existing ads - If you need to modify text and/or URLs of +500 ads, which would take you hours if you do it manually.
Some limitations:
There can still be some bugs, such as when changing the objective. As each objective (traffic, reach, …) has different columns, there will be errors when you change the campaign objective and there are columns from another objective.
Also, with a split test it is not yet possible to duplicate it via “Bulk Import & Export”, because the split test is not specified within Excel via a column so it will just be a normal campaign without the 50% split of budget. In case you gave the ad sets the same name it will put the creatives that you want to A/B test within the same ad set instead of splitting it.
Step by step guide
Select the campaign you want to adjust or duplicate
Click on Export > Selected
Open the excel and make adaptations
Select all fields & press copy
Click on Import > Ads
Either select “Text or Excel file” or “Copy and paste”. The most straightforward option is “Copy and paste”.
Receive message from Facebook Ads Manager: either Successful or Errors:
Adapt the file to erase the errors
Conclusion
Facebook “Bulk Import & Export” is definitely a time saver when it comes to setting up or editing large amount of campaigns, ad sets or ads.
The tool can be very powerful for transferring existing campaigns to another / new account or making edits in bulk (e.g. URLs in carousel ads), but there can still be some limitations.
We’re excited to find out more about what “Bulk Import & Export” has to offer and about the next features and improvements in the future!
Some interesting resources when you want to implement it:
When opening, a blank sheet appears with pre-filled column names. The blank template includes fewer columns than with an export of existing ads or campaigns, as it will be used to create new ads that haven't run yet.
Omnichannel is everywhere. A couple of years ago, this was a new phenomenon, but we’ve evolved towards a digital advertising spectrum where store visits are getting more and more incorporated in the marketing strategies and objectives.
Store visits
In short, store visits have the objective of linking the user who clicked an ad to a brick-and-mortar shop visit. Calculating store visits is as simple as this:
A consumer signed-in and opted-in to location history clicks an ad
This consumer then visits a store within a defined period of time
A store visit is reported, aggregated & anonymized, and allocated to the ad click
From a technical point of view, GPS, Wifi triangulation, geometry, Wifi scanning and location history are used to define whether or not a consumer is going in-store. Note that within a certain interval of confidence, the data are extrapolated for the population. Finally in terms of accuracy, thanks to all tracked data, measurement is as accurate as 1 meter. It is consequently good enough to make the difference between someone who is hanging around your store, or inside your store.
Next to measuring the volume of brick-and-mortar store visits were influenced by your online investment, Google Ads offers a lot of extra interesting insights that provide valuable information for your business:
Omnichannel ROAS
Impact of distance on store visits
Demographic profile of store visits
From ad click to store visit
New vs returning visitors
Store visits data per individual store
Omnichannel ROAS
Knowing how many store visits are generated by your online investment, allows you to calculate an omnichannel return on ad spend (ROAS). By using a simple formula, we can easily extrapolate the data to estimate a total revenue generated:
Offline Revenue = # Store visits * In-store conversion rate * Avg Order value
Omni-channel ROAS = Omni-channel Revenue / Total marketing investment
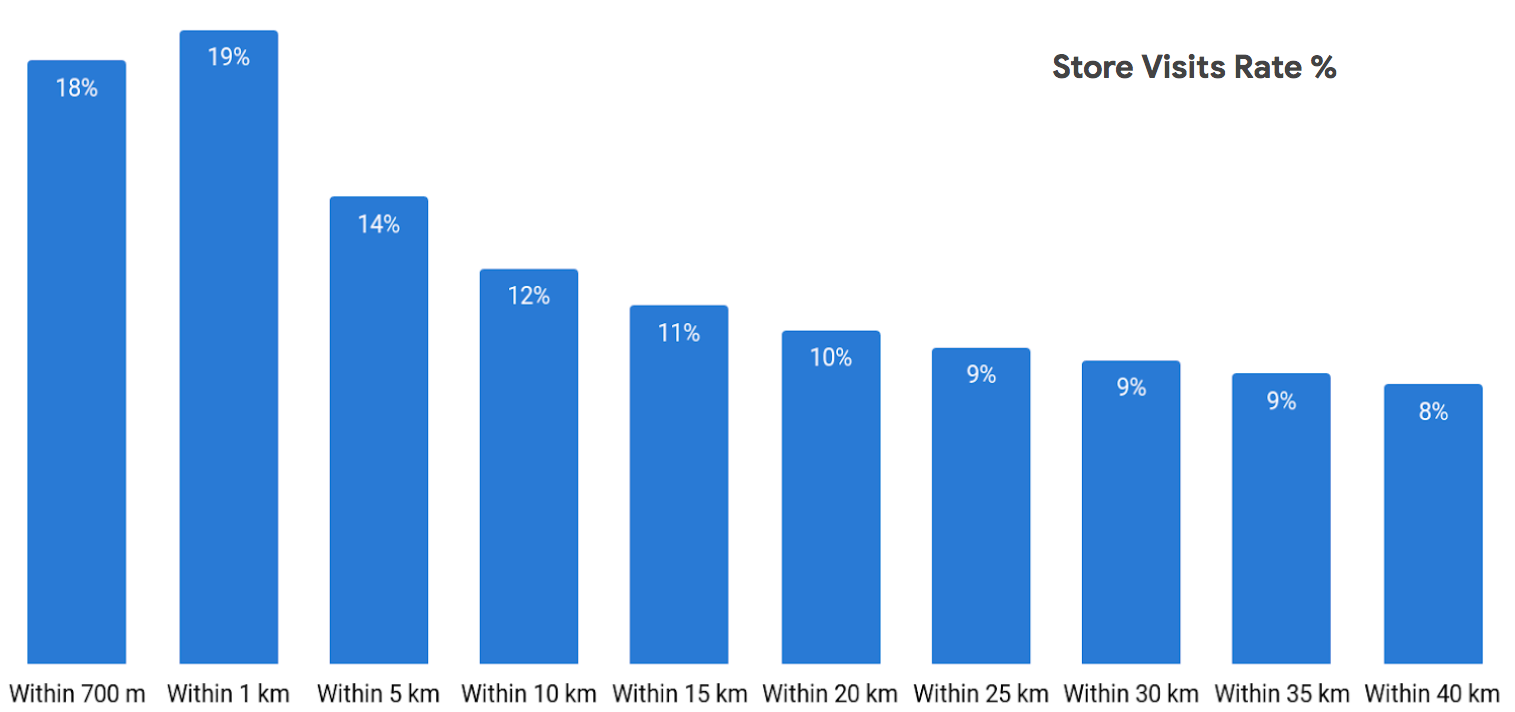
Impact of distance on store visits
Analyzing the Distance report (Reports > Predefined reports (Dimensions) > Locations > Distance) can give you insights in the volume of store visits based on the user’s distance from your business’ brick-and-mortar locations when they click your ad. These insights could result in the following information:
Based on the graph above, we observe that users who are closeby a brick-and-mortar store are more likely to visit the store. Based on this you can play with the messaging you send out to the user, to increase relevance. For users who are close to your business: focus on your brick-and-mortar stores. For the users who are further away: focus on your e-commerce (if relevant).
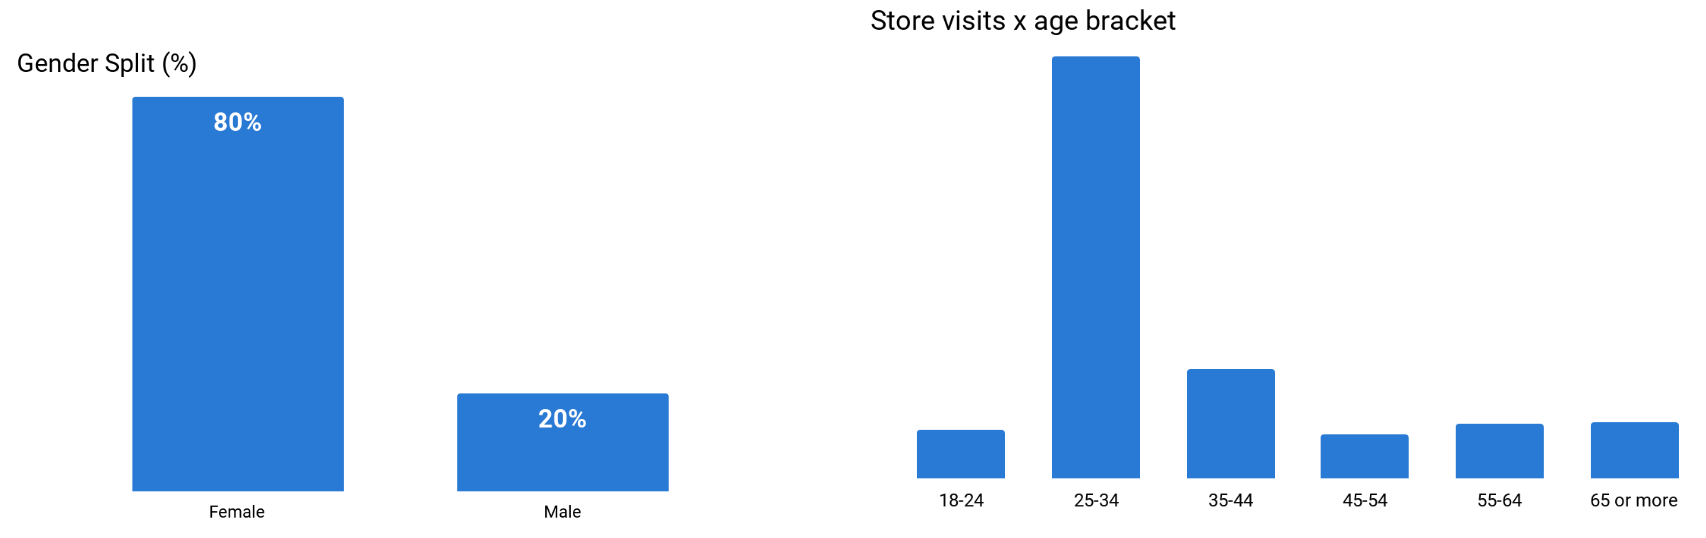
The demographic profile of store visits
Interested in knowing who is visiting your brick-and-mortar stores? Doing in-store analysis might be though and very time-consuming. So, why not analyse the demographic profile of the store visits driven by your online investments? Within the Demographics report you can easily segment your conversions focussing on the store visits. This can be done on account, campaign or ad group level.
In the example above, we notice that store visitors are mainly women between 25 and 34 years old. Of course, these are interesting insights for you as a business in general, but you can also take this further into your online advertising by adapting your bid adjustments accordingly, to make sure you can reach your target audience.
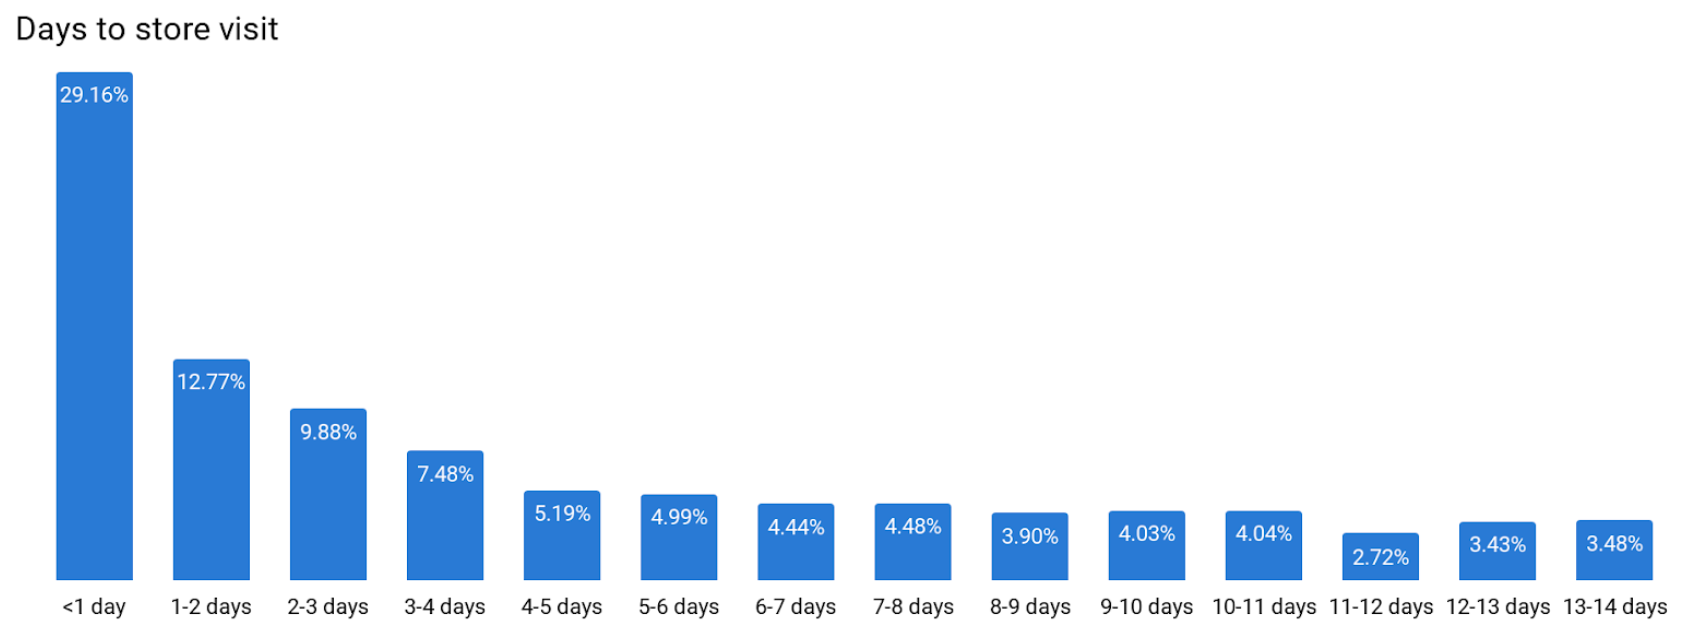
From ad click to store visit
Analysing how long it takes for a user to visit your store after clicking an advertisement, can be consulted by adding the Days to conversion (Segment > Conversions > Days to conversion).
In the graph above, we notice that almost 30% of all store visits happen within 1 day after the ad click. This can be important to bear in mind when optimizing your ad copy. Knowing users who look for your business have a high intent to visit your store within a short time frame, it is important to include a strong call-to-action related to this. Also bear this in mind when communicating on temporary or short-term promotions.
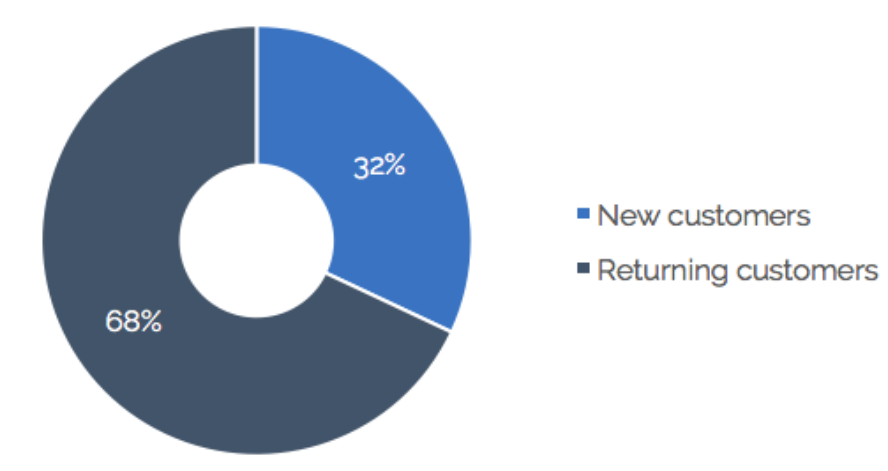
New vs returning visitors
Adding the New vs returning customers segment to your store visits data gives you insights in whether the customers who visited your store after clicking an ad, had already visited your store before. “New” is in this case by default defined as a customer who has not visited your brick-and-mortar store in the previous 6 months. The lookback visit window can be adjusted to any period less than 6 months.
This type of insights can be useful to answer a question that often pops up in the context of store visits: “Would the users who visited my brick-and-mortar store not have visited the store anyway, also without having seen an advertisement?” Based on the data above, we could state that for at least 32%, the online investment has most probably caused the store visit.
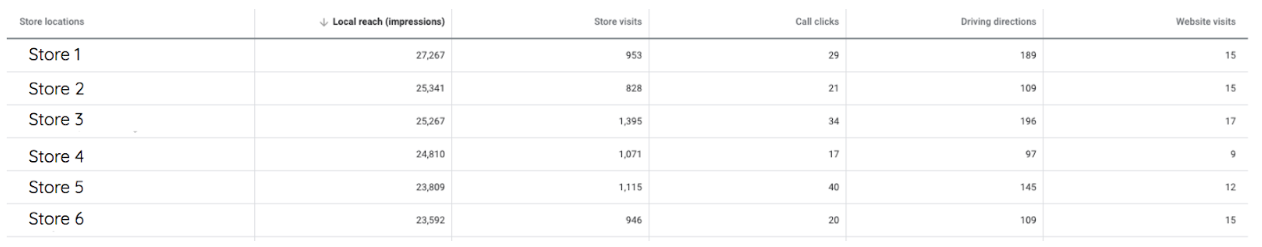
Store visits data per individual store
As a retailer with multiple brick-and-mortar stores, it is interesting to know how which are the best performing stores in terms of footfall traffic. Good news! Google Ads provides insights such as reach, store visits and call clicks per store. To have a look at these mterics, navigate towards Locations > Geographic report > Per store report.