Latest Articles

Data Studio Tip: How to report on multiple conversions

In Google Data Studio, you most likely have multiple conversions you want to report on. Either you have a webshop for which you want to track your sales, but you also want to track other micro conversions, such as people adding an item to the cart or people simply clicking on product details. If you’re a B2B player, you might want to track your lead forms, as well as people downloading a whitepaper.

Let’s take the latter as an example. For a B2B company, we want to have an overview in Google Data Studio of all our lead forms, as well as our whitepapers downloaded via our Google Ads campaigns. Both of these conversions are tracked directly in Google Ads. They are two of our most important conversions and we need to report on them separately.

Next to the conversions, we also want to have a view on clicks, impressions, cost per click, click-through-rate, CPM and the cost per campaign. 

If you want to have conversions directly coming from Google Ads, you can only add the metric "Conversions", and not a specific conversion, like you can see in-platform. Therefore, what Data Studio actually does, is count up all the conversions you have in your account and link them to campaigns, ad groups or whichever dimensions you want. If you want to look at a specific conversion, you have to filter via "Segment Conversion Type Name". 


What's the issue? Well, there are two actually:

  • If you filter on one conversion, it filters all metrics you put in a table. So it will only take into account the clicks, impressions etc. that are linked to the conversion you filtered on. It's fairly similar to what you have when selecting a Segment in Google Analytics. Most of the time, this action will even give you a Data configuration error.
  • You can't split out separate conversions in two, since your filter will automatically be applied on all metrics in the same table.


What's the solution? 

The easy solution would be to report on your conversions in different tables, but if you want to have all your conversions in one table without splitting them out (which is the preferred option here), you can fix this via Blended data

Here are the different steps:

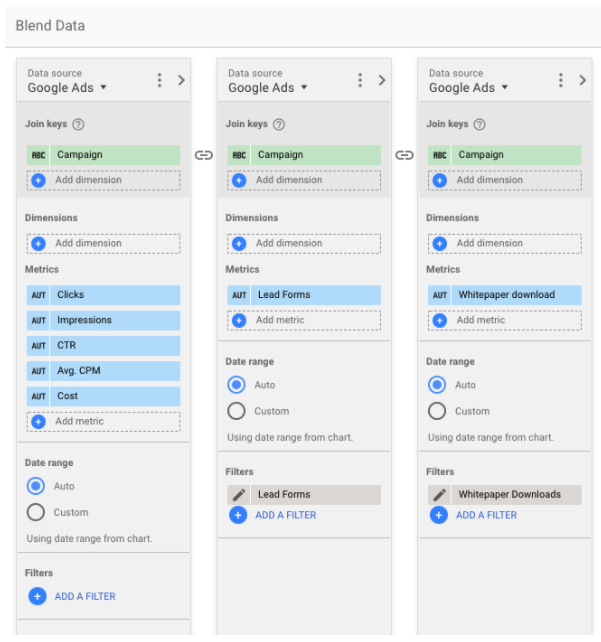
  1. You select all your dimensions in your first data source together with all the metrics you want to leave unfiltered (i.e. non-conversion related metrics like clicks, impressions etc.).
  2. You select conversion 1 (in our case: Lead forms) with the same dimensions, which you put as "Join keys". In fact, if you're using the same data source, you can use all your dimensions as Join keys. On this data source, you filter on your conversion name via "Segment Conversion Type Name". 
  3.  You do the same for conversion 2 (in our case: Whitepaper downloaded). 
  4. Repeat for how many conversions you want to report on.

The result should look like this (Note that I have renamed the metrics “Conversions” to my conversion naming in data source B and C. The metrics are the same in both data sources, only the filtering is different.):

 Example of Blended data of multiple conversions from one data source

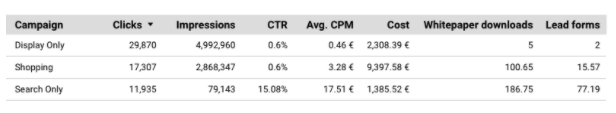
This way, you can have your Lead Forms, Whitepaper downloads and other conversions in one table, without the filtering affecting your other metrics.

Example of table with multiple conversions from one data source

{snippet robbedesmyttere-en}

Monitor your competition in the Merchant Center

Keeping an eye on the competition should be an essential part of building the strategy of your business on all fronts. Knowing your competitors' do's and don’t is necessary if you want to keep your edge and find ways to differentiate yourself in the eyes of your customer. It will give you learnings and insights on where the market is heading and point you towards new opportunities. 

Best sellers report

Google Merchant Center is bringing us some new tools to monitor the other players in your market. The first one being the “best sellers report”. Using this tool you can spot the most popular products and brands for different retail categories. You can filter on the country you are interested in and on the category your business is selling in. The different categories are extensive and you can filter quite detailed to find the information that matches your business. You could for example filter on health and beauty and go as deep as nutritional sports bars. 

Google Merchant Center Best sellers report for products 1

Google Merchant Center Best sellers report for brands 2

In the report, you will see the products and brands ranked by popularity in Google Shopping. This popularity is based on an estimate of Google on how much of the product or brand was sold. You will also see how a particular brand or product evolved compared to the week before. This can be very convenient if you are, for example, following up on a competing brand or product every week. Lastly, you will get an idea of the price range of a product. 

Monitoring these results on a regular basis can give you insights on what products and brands are doing well in your category. You can take action on this, by, for example, adding those products to your offer or adding something similar. Brand owners can also spot that maybe they should be competing a bit harder to become one of those popular brands. Lastly, it could also be interesting to know what products and brands do well when you are expanding your business into new categories.

Price Competitiveness report

The second new tool is the “price competitiveness report”. This tool gives you an idea of how your pricing compares to your competitors. You can do this on four levels: brand, category, product, and product type. You will see what percentage of your products have a price that is higher, lower, or similar compared to a benchmark price. This benchmark price is based on the pricing from competitors weighted based on the number of clicks they receive. 

Google Merchant Center Price Competitiveness report 3

If you filter based on your specific products you will see how your price compares to a benchmark, if available. You will see that benchmark below your own price and next to it the percentage difference. This is based on the current price. Prices of course fluctuate, so next to that you also have a comparison to a benchmark based on your chosen time period. 

Keeping an eye on these numbers can benefit you in the following ways:

  1. It can give you relevant insights when you are choosing what product to put forward in your advertising campaign. You could for example attract people with one of your products that is better priced compared to your competition.
  2. You can also take this report into account when deciding on the pricing of your own products. 
  3. Lastly, these numbers could also give you an idea of why your Shopping ads are performing a certain way. Maybe you saw a drop in your CTR on your Shopping ads. Seeing that your average price has increased compared to the benchmark could give you some explanation on this. 
Conclusion

It’s important to follow-up on your competitor’s behavior. Google Merchant center report gives us an extra easy tool to do so. Checking the best sellers report will help you in knowing what products and brands are doing well in your category of interest. Monitoring your price competitiveness report shows you how your pricing is compared to the competition.

{snippet jennifernollet-en}

How to get started with CRO experiments

If you are working for a company which is generating online conversions, you probably already looked for ways to generate more conversions on your website. This can be done thanks to Conversion Rate Optimization. CRO is a process that will help you improve the conversion rate of your website, by increasing the percentage of website visitors who convert. A conversion can be any action taken on your website, might it be a micro conversion (for example a registration) or a macro conversion (for example a purchase).

In this article we would like to focus on the experiments, which allow you to test changes on your website and see how they perform. We’ll present 4 useful guidelines to follow in order to make the most out of your experiments. 

1) Every experiment needs a hypothesis

The starting point should always be a hypothesis, which consists of identifying a problem on the website and suggesting a solution that could help solving that problem. In order to define a good hypothesis, you need to make this clear:

  • What do you want to test?
  • What is the expected outcome?
  • Why do you test that?

Example: by adapting the message on the homepage for users who come on the website for the first time, we would like to increase the conversion rate of account creation. Knowing that the membership rate is rather stable, if we manage to increase the number of account creations, we should be able to generate more memberships.

In order to formulate your hypothesis, don’t trust your feelings, trust your data. Once you collected enough data, make decisions based on actual numbers.

Some tools and techniques can help you collect data and gather insights such as: marketing analytics tools, heatmap analysis, feedback polls, asking people (who have never used your site before) to perform a task on your website to get their feedback, etc.

2) Test only one variable at a time

Don’t run too many tests at the same time on the same page. Testing one element at a time is the only way to get actionable feedback, as it will allow you to know what type of changes made what type of effect. If you test different elements at the same time, you won’t know at the end which element caused the potential change.

If you still want to test different elements at the same time, you should go for multivariate testing, not A/B testing. A MVT (multivariate test) tests variants of two or more elements simultaneously to see which combination creates the best outcome.

3) The goal must be well-defined

Goals measure the success or failure of an experiment. That’s why it’s important to clearly identify a key metric that is directly linked to the experiment and that will define whether it is a success or not. For example, if you are optimizing the call-to-action to encourage website visitors to create an account, the goal will likely be to increase the number of account creations, not the number of memberships. 

If there are different goals that you would like to monitor, just make sure that each experiment has only one primary goal. This primary goal will determine whether or not your experiment is successful, all others will be secondary goals. 

4) Let the experiment run for as long as it takes

Once your experiment starts, you might tend to constantly check how the test is running, but know that experiments can deliver quite volatile results in the beginning. Give it some time and wait to generate enough data before validating your results and taking conclusions. It is recommended to let your test run until it has reached a statistical significance of 95% or more.

Even if no winner has been found, the data might show that there was a clear loser. In this case it means that this change shouldn’t be implemented on the website. 

Conclusion

There is no secret recipe that will help get your number of conversions off the ground. This is because of context and because all websites are different, all website visitors have different needs and will interact in different ways. 


CRO is a never ending process of defining hypothesis, testing, measuring, learning and optimizing. At Semetis we believe that the best way to succeed is to never stop testing! Yes, a lot of tests will fail. But don’t get discouraged if your tests have a negative outcome, it’s actually an opportunity to learn and the insights you get from your tests can become future experiments. There are endless opportunities for things to test and the more you test, the more chances you have to find ways to improve the conversion rate on your website.

Happy testing!

{snippet justineheeren-en}

Cookieless Series Part 1 - How ITP & GDPR are affecting your marketing results

This article is part of a series of 7 articles. The purpose here is to give you more context around the current status of cookies in marketing and the impact of ITP on your marketing/analytics platforms. Our next article will then go deeper and will sketch a clear vision on the future of advertising and how you should tackle it as an advertiser

I intended to write that the industry is changing, mid-sentence I changed my mind: the industry is improving. Over the last years, we’ve witnessed two acronyms entering the digital marketing industry: GDPR & ITP. Both trends have an impact on user privacy and both were initially seen as a threat. Why? Let’s start with a short recap:

  1. The General Data Protection Regulation (GDPR), launched in May 2018, is a regulation in EU law on data protection and privacy in the European Union. GDPR aims primarily to give control to individuals over their personal data. Out of that, a new toolkit was born: Cookie Consent Management systems. To put things simply, users that visit a website and are not accepting the cookie consent can’t be tracked anymore. Afterwards, other data protection laws popped up such as the California Consumer Privacy Act (CCPA)

  2. ITP or Intelligent Tracking Prevention is a feature that was initially added to the Safari browser (Apple) that restricts user tracking through cookies. Meaning, ITP limits publishers and advertisers to track users across domains, which has a big impact on conversion tracking and remarketing. As of May 2019, ITP2.2 (current version 2.3) came to life, where third-party cookies are automatically removed by the browser after 1 day. Also, Firefox adopted this technology.


How is this impacting your marketing platforms?

Even though Safari and Firefox aren’t the number 1 browsers, their impact on your ability to measure advertising is noticeable. Cookies are used for two big reasons in marketing:

  1. Platform conversion tracking is based on cookies. This has the biggest impact. In most platforms when users click your ads, they have up to 30 days to convert, after which that conversion will still be attributed to that ad. Again with ITP, this is reduced to 1 day. Meaning that if I'm using Safari, clicking your ad, and converting 2 days later, this conversion will no longer be attributed to your marketing campaign. Not all platforms have this issue. Facebook for example handles conversion tracking at user- instead of cookie-level, as you always need to be logged in to their platform before encountering an advertisement.

  2. Audience creation is based on cookies. Meaning that on ITP-protected browsers, even though we create a 30-day remarketing audience, users will get removed from that audience after 1 day. So you will see fewer users in your audiences, indirectly causing more pressure on the same users.

Following this logic: the campaigns that should be impacted the heaviest will usually be your Remarketing campaigns, measured in Google Ads, as they are challenged by both limitations.

Looking at the vast amount of data we can access through our client portfolio, we’ve confirmed this hypothesis. As the default attribution in Google Ads is 30 day last-click, and in Google Analytics last-click, non-direct, we most often see big differences in trends between our conversion rates in Google Ads & Google Analytics. The graph below containing conversion rates of 2018, shows exactly that.

How ITP GDPR are affecting your marketing results 1

When plotting the same graph for 2019 we notice, weirdly enough, a clearer trend between both platforms (downwards trends to be neglected as it was due to client-specific seasonality).

How ITP GDPR are affecting your marketing results 2

In other words: measurement in Google Ads is becoming closer to measurement in Google Analytics as 30 day post-click, with an automatic cookie deletion of 1 day, is becoming a closer variant to last-click non-direct.

How ITP GDPR are affecting your marketing results 3

On the image above you can see that the bigger drops in Google Ads Conv. rate appears after the ITP releases. This means that we need to be careful with our YoY comparisons as we might be comparing apples to oranges.

How to discover the impact on your analytics?

Next to the advertising platforms, we’re also seeing an impact on Google Analytics.

  1. New vs Returning Users: As cookies are getting removed, a user that comes in more than 1 day later than the previous session, will be tracked again as a New User instead of a Returning Users.

  2. Increased attribution to direct: Analytics doesn’t recall the previous source/medium of the users anymore when its cookie gets deleted. This means that when a user comes in through google/cpc and converts 2 days later through direct, this conversion will be attributed to direct (even in the last-click, non-direct model).

Data is never 100% accurate, and that is fine as the objective is to understand trends, not details. But it’s important to know how biased your view is so you don’t end up making the wrong business decisions. For ITP you can create a segment in Google Analytics in order to calculate the number of users visiting through ITP-protected browsers. I can strongly recommend you to follow this article in order to create a similar segment for your GA account.

 How ITP GDPR are affecting your marketing results 4 

The visuals above from one of our clients show that the effect sneaks in more and more closer towards the end of the year on which ITP was launched (most likely as users update their browsers to the newer - protected - versions over time). We, therefore, recommend you to also have a look at your data, in order to discover how significant the impact of ITP on your business is today.

In this article, we gave you more context around the current status of cookies in marketing. 

Saying that things are changing, is an understatement. No one knows exactly where it will bring us, but at least we are aware of what’s happening so we can anticipate the years ahead. Our next article is exactly about that: we will go deeper and will sketch our vision on the future of advertising and how you should tackle it as an advertiser.

{snippet fredericpalella-en}

Subcategories

Semetis Icon